Coin Vol-II Hedging your BTC/ETH - The basics
This is not investment advice. Research purposes only.
Welcome back.
Part one of this series went over some basic features of ledgerX’s options market for derivatives on BTC/ETH. The gist of that post was that, at that point in time, left tail volatility was cheap vs. historical realized vol, and right tail vol was overvalued. The market was largely betting on non-linear gains in BTC (which would be a dumb-ish thing to do if you already had a lot of long BTC exposure). Coincidentally over the next few days crypto tanked >8% or so on news of promised regulations and legal moves against Tether. The volatility market on BTC reacted like a deer in the headlights and this post will describe that. There was a lot of opportunity there for anyone who was long BTC, or ETH to avoid loss at a very low cost if they understand how vol behaves. Before I go through the math of how to hedge your exposure, I want to discuss the behavior of the vol market a little more. It’s critical to understand how vol behaves to reduce risk by buying options, because every option has both intrinsic and implied volatility (market options demand) value.
What does a smart vol market look like in crisis
Volatility is a complicated abstraction living in the minds of hundreds of Ph.Ds working against each other, and options are a market on volatility. Vol has several dimensions (time, strike, rate, put/call), and the cards are stacked against the homegamer, who probably has no access to data and mathematical tools to understand it. Further complicating the situation, volatility behaves differently on different assets, sometimes because the underlying is different, and sometimes because the market for the volatility is different. There are simple features though which can be easily understood if the data is properly visualized. These features are more obvious when the market is well-made, and so let’s look at the best one:
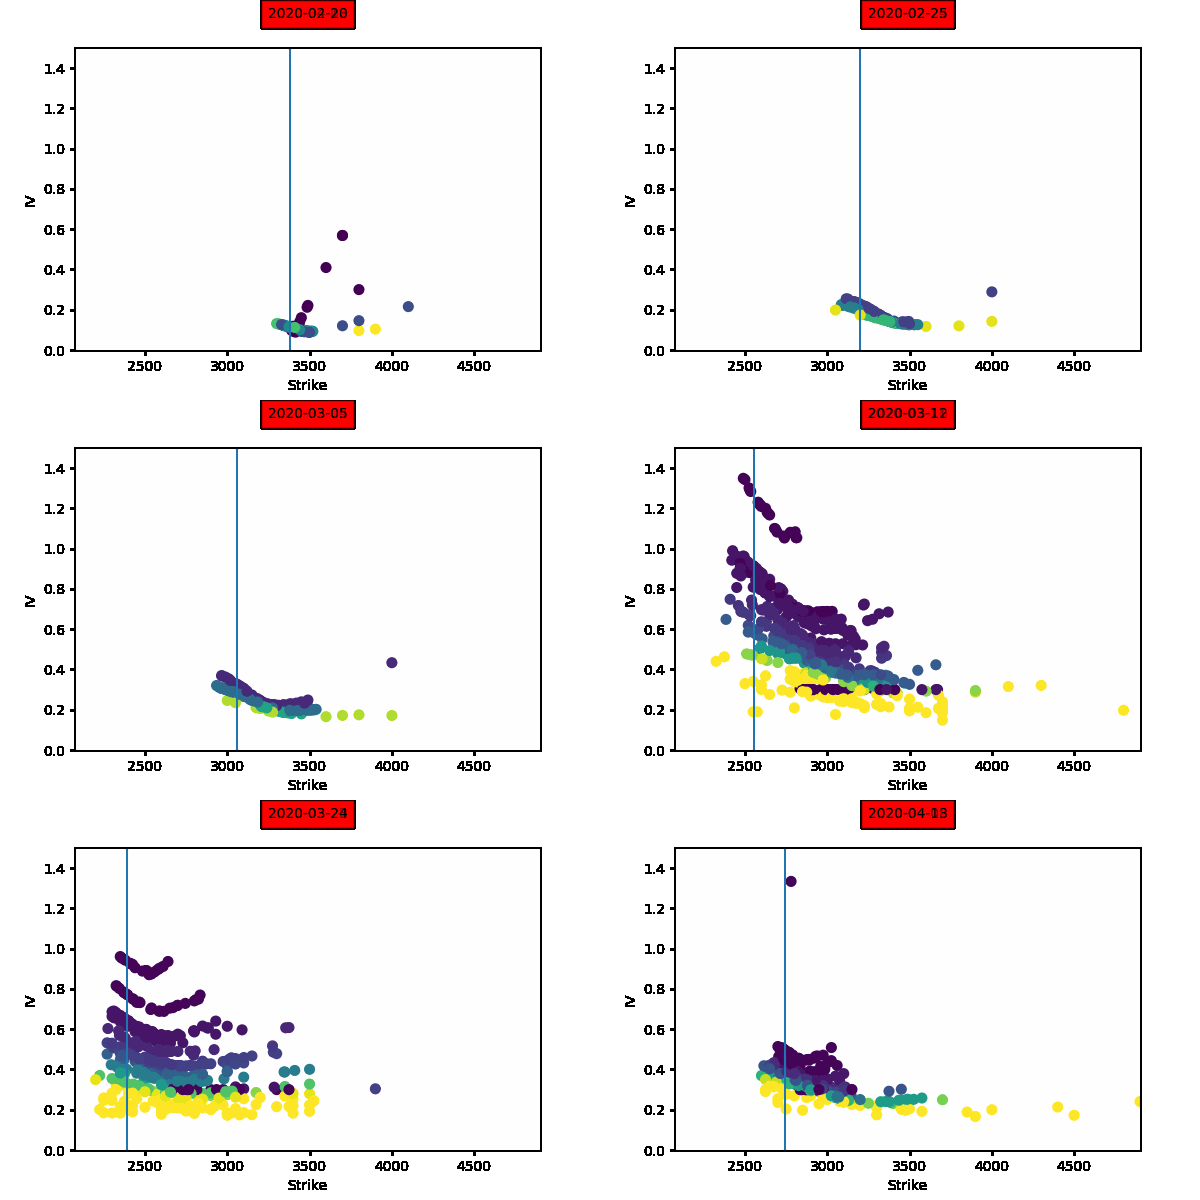
This gif shows you what SPX’s vol surface (the most intelligent and liquid options chain in the world) did during the Feb - March 2020 Coronavirus crisis.
 .
.
In this image the color is the day’s to expiration of the option (yellow is 120 days or so and bluest blue is zero.) The vertical blue line was the spot-price of the SPX index on each timepoint. There’s a lot of information here, let’s unpack this:
- Bid/ask spreads on SPX would be almost invisible on the plot.
- Implied vol directly related to the markets demand for options. As implied vol goes up, option prices go up super-linearly.
- At-the money (at the blue line) vol is priced differently at different expirations. This is called term structure, and it is closely related to the volatility-of-implied volatility. As option prices on SPX fluctuate, the premium paid for near-expiring volatility becomes much greater because the volatility of volatility increases.
- The surface is continuous and well-made. Market makers arb out any inconsistency between nearby options vol-prices very quickly if large trades move the price of an option off the surface. The surface shape is maintained by market makers making collective bets on many options at once based on the overall shape of the surface, not individual strikes like it would behave if made by non-mathematical retail traders.
- Options vol surfaces curve because of the (anti-)correlation between volatility and the spot. Because SPX vol often will go up as spot loses value (because people need to cover short-vol bets), implied vol increases with strike below the spot price. It does so non-linearly. This is the reason out-of-the-money puts can make returns factoring in the hundreds in a crisis.
- Notice that the slope of the left and right nearly linear parts of the vol surface don’t really change much even though the world was literally falling apart. This is because the clever risk desks who make the market use parameters which are well calibrated against even extremely volatile events and don’t change much from day to day. This lends an overall stability to the intelligently hedged market.
- The fact that durable businesses can make money while keeping vol-surface parameters that remain so smooth, points to the fact that options on SPX are priced very fairly by these models with a slight tilt to sellers. A novice trader often imagines: “I know this will go up, so I buy a call” but the index vol market says: “eh, whatever information you think you have barely changes the surface: your certainty is a fallacy”.
- To this point, taking positions on SPX index options for the purposes of speculation rather than hedging is an act of great hubris. The market largely exists to provide efficient insurance for people with index exposure.
Options traders practiced in qualitative jargon (which I encourage the reader to try to not focus on in favor of mathematical behavior) Will speak of “sticky-strike” or “sticky-delta” behavior of volatility surfaces. That’s shorthand for the behavior of volatility as the spot moves. In this case, the volatility of an option looks relatively pinned by it’s strike, and would be called sticky strike.
What does the LedgerX market look like now?
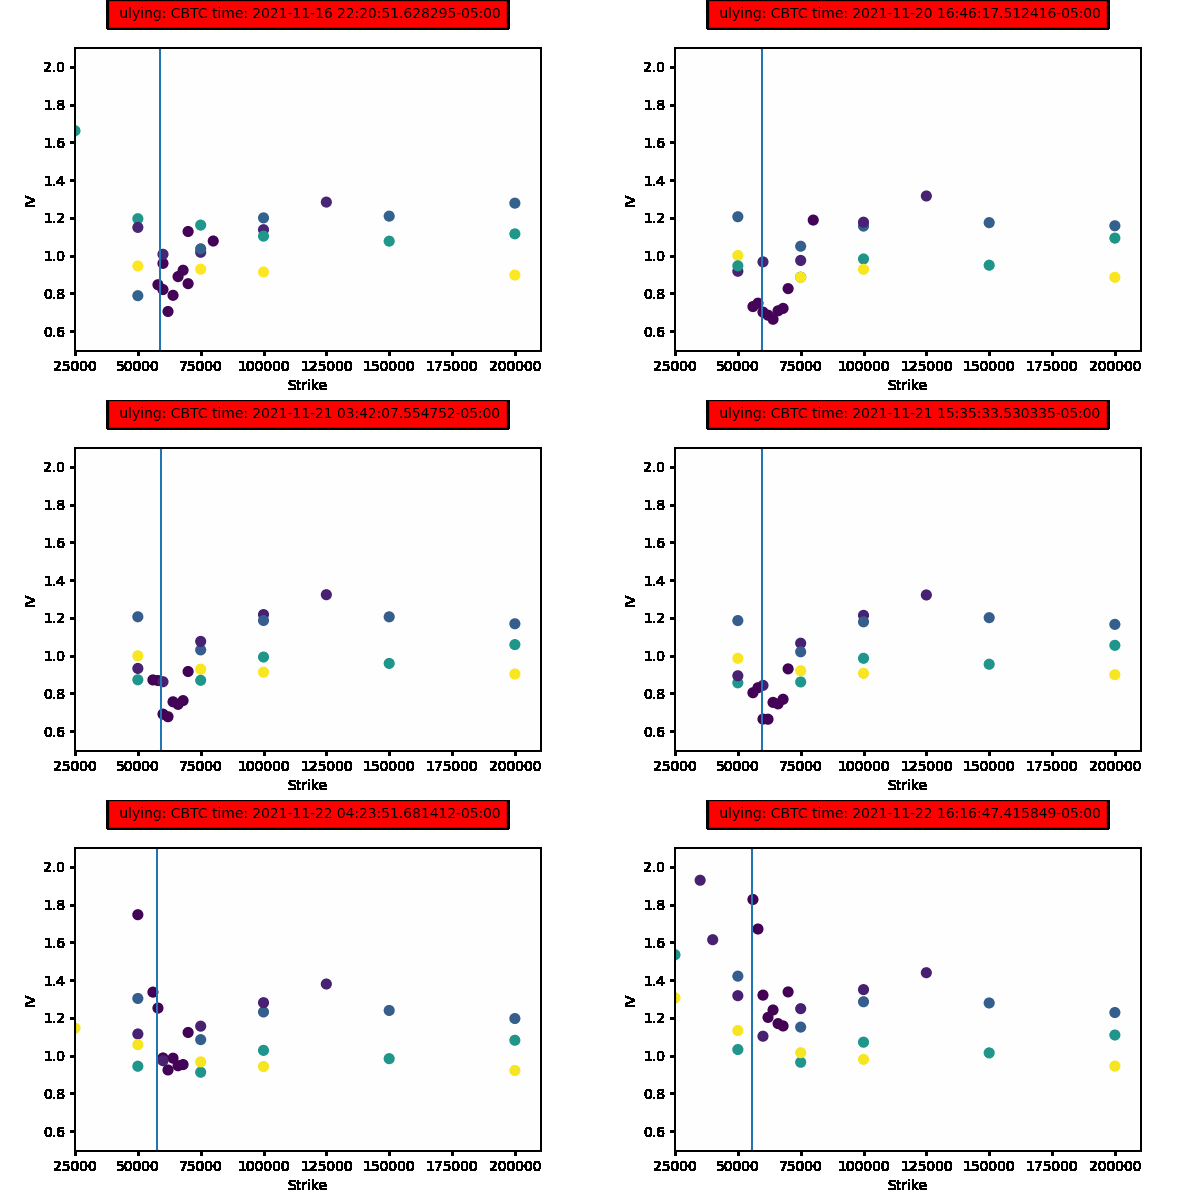
As of time of writing Bitcoin has been hopping around up and down to the tune of 7% a day. Here’s an example of the behavior of the vol surface on the ledgerX exchange:
 .
Note the much sparser strike coverage, and significant distortion of the volatility surface ATM where there’s drastically more volume. This volatility surface was made only using the calls, which are much more liquid than puts, although put-call parity is arb’d fairly well in this market. Observations:
- Unlike SPX, in which the majority of the open-interest is held by intelligent players who will continuously re-hedge exposures to avoid large loss. The BTC options market seems to have inherited it’s ‘diamond hands’ culture from the underlying. As the dropping spot takes calls out of the money, vol just skyrockets. The market’s implied future spot doesn’t change much.
- The term (days to expiration) structure of the vol surface is incoherent with the realized volatility of volatility. In mathematically rigorous stochastic models of volatility, when volatility becomes more volatile (for example because IV goes from 50 to 150 as spot goes from 58k to 53k) this volatility-of-volatility means that future-expiring vol should trade at a serious premium or discount to present vol. This days-to-expiration curve for the price of vol is called “term structure”. The BTC chains term structure is at present, not reacting to volatility at all.
- BTC vol is even more sensitive to spot than SPX, which should lead to greater convexity for put bets as long as put-call parity is enforced.
- Although it’s less obvious from this particular plot, in some cases the term structure can be explained by well-known events which will occur in the future, for example promised ETH2.0 dates.
The next post will outline how and why to hedge crypto exposures using this information.