Coin Volatility Surfaces
This is not investment advice. Research purposes only.
Crypto Volatility Markets
Diversification has been called the only free lunch in finance, but that was before cryptocurrencies were invented. Still, even for crypto, diversification is a good idea, and volatility is perhaps the most robust diversifier for any asset. When finance types use the word volatility, they mean exposure to uncertainty in an asset’s future value in the form of options. Note: this is very different from how capital-deprived WallStreetBettors views options, as leverage for making unhedged martingale-like bets on underlyings. However there is a growing population of people who are holding small new-money fortunes in crypto who should probably learn a thing or two about risk management. It seems like the popularity of these markets should grow. This post is the first in a series on the US crypto volatility markets to explore their usefulness as hedging instruments. Lets note the several attractive features of crypto options.
Pros:
- Regulated! Vanishingly small danger of Mt.Gox like events.
- Open! The exchanges offer book data you probably won’t have on equities.
- Lower custody risk (transfers out of your account occur in the usual regulated finance system. Two factor is less likely to be hacked/forgotten than a file-based private key wallet)
- Improves capital efficiency of bullish bets. (Make more return with less cash)
- Allows risk management
- Allows premium reaping (can sell volatility to make carry interest on coins while holding them)
- No management fee like a crypto ETF
- Allows bullish bets on the crypto with less correlation to the crypto itself
- Allows short exposures with less capital (puts require less margin than shorts)
Cons:
- Regulated. (No tax crimes: feature or bug? you decide)
- More dimensions than simple long/short
- Math Required
- Illiquid (transactions are costly)
- Risky if you’re unprepared
Crypto volatility markets are young, and illiquid vs. traditional financial products, that much is obvious from the bid-ask spreads near 20% of the premium that you see on regulated retail exchanges such as FTX’s LedgerX. Still without doing a bit of math it’s not obvious roughly where things are at the moment. This post basically describes the broad-strokes parameters of these markets at the time of writing (Nov 2021)
The liquidity of options on LedgerX
Although, I’m a fan of the LedgerX crypto options market, it’s an extremely immature market at time of writing, the median bid-ask spread on BTC and ETH options are 17.8% and 20% respectively. Roughly speaking this means that an inexperienced trader would need to make more than 20% of mid on their bets to realize any gain. Volume is concentrated at a few near-the money call options, and presumably driven by speculators looking for leveraged long bets on these assets.
Realized Vol in BTC, ETH
If one fits an asset’s price history to a geometric Brownian SDE model \(X_{t+1} \approx X_t + dt*\mu + N(0,dt)*\sigma\) the sigma parameter of that fit is called ‘realized volatility’ and measures how noisy an underlying was in the past. Options are usually priced using geometric Brownian models, and each option price implies a different value for \(\sigma\), called the ‘implied volatility’ of an option. These two types of volatility number have the same units, and are usually similar. However realized volatility looks backwards into the past, and implied volatility is a market’s anticipation of the future (combined with the effect of the market’s demand for options). So before talking about implied volatility as a function of strike and expiry (the vol surface), let’s look at realized vol on BTC, ETH.
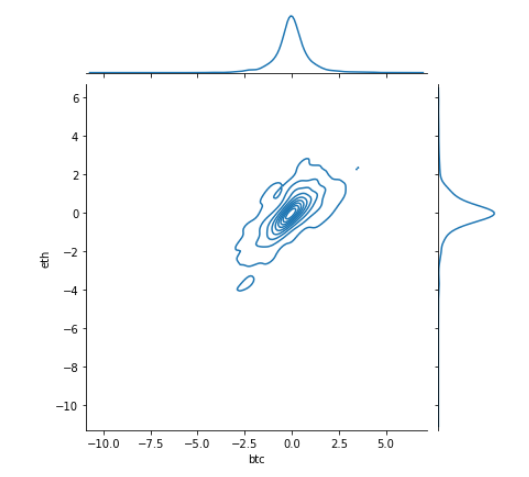
Since 2017, BTC RV is at 79.9%, and ETH RV is slightly higher at 100% a little less than the typical volatility of VIX futures. When you calibrate a geometric Brownian model you transform the price into a series of near-normally distributed random increments, and it’s useful to look at the correlations between these increments. Here’s a density plot of the correlation between the noises driving BTC,ETH which is very high (76.2%). One should note it’s more fat-tailed than a normal distribution, but the correlation is well behaved even in the tails.
 .
.
Black-Scholes Vol surface modeling is a very artistic science. Some details would affect these results strongly, so let me mention some parameters of the modeling:
- The rate used is the current US 2-yr Treasury.
- The price used is the ‘qmid’, the bidsize/asksize weighted mid.
- The math is all done in my own pytorch modules.
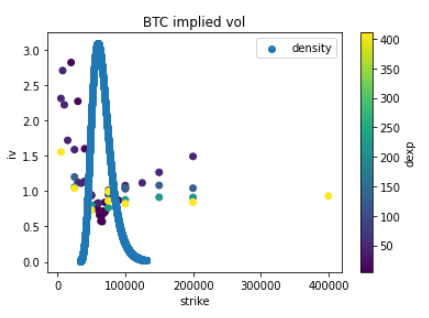
Implied Vol in BTC
Usually the equity options market is willing to pay a premium above realized volatility to get the exposure options offer, and implied volatility lies above realized. It is also common for implied volatility to grow near expiration, as people hold onto out of the money options which will become worthless. The implied vol-premium within the ledgerX market is very low. -.50 delta puts expiring in 5 days on BTC can be had at 57% implied vol, a symptom of the market’s bullishness about BTC. With BTC sitting at all-time-highs, it’s remarkable that put protection on such an outperforming asset can be had at such a discount relative to realized.
Indeed that 50-vol was so cheap, I couldn’t resist buying and sold it at a tidy 20% profit the next morning.
There is some reasonable term structure in the out-of-the-money puts (their IV grows near expiry). The surface is very well-fit with traditional stochastic volatility surface models, qmid prices are reproduced with better than one-percent accuracy from a few parameters. This suggests the presence of traditional options-market makers. Note that these players will enforce things like put-call parity, which in this market would basically finance put-selling with the excess demand for calls. In short, puts on BTC are a fantastic deal this instant -perhaps not tomorrow.
From that continuous surface one can calculate the market’s implied density of forward BTC spot, the 30 day forward implied density is shown on the same plot with the volatility. This type of ‘fat-right tailed’ density is the opposite of what would usually be seen in an equity market. SPX usually creeps upwards and races down, leading to a fat left (downwards) tail in implied moves in the options market. The BTC market is the opposite of that right now.
The ledgerX options market on BTC is in an intriguing and attractive place. It appears that intelligent market makers are already present, imbuing the behavior of the vol-surface with predictable dynamics much like an index option. This is vital, because if the surface were being made only by people who are not really able to do correlated math on the different parts of the surface, it’s structure would look more like low-cap US equity option, somewhat random and unreliable. The next post in this series will review the basic math a BTC whale would need to hedge their exposure and calculate some basic costs of that hedging.